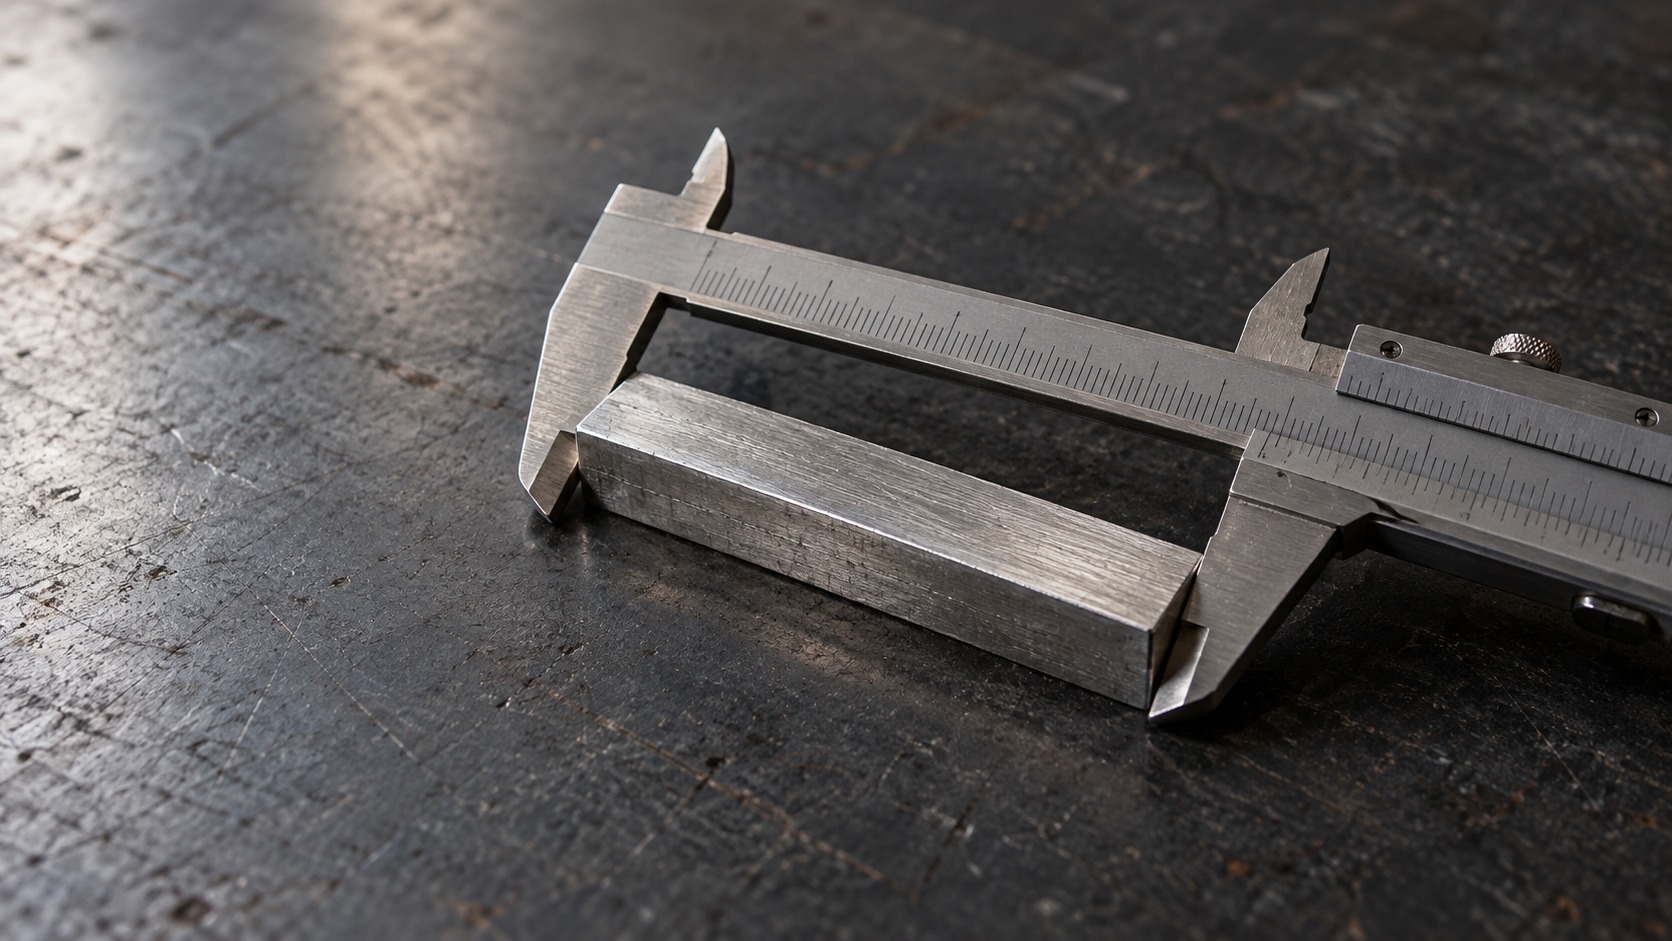



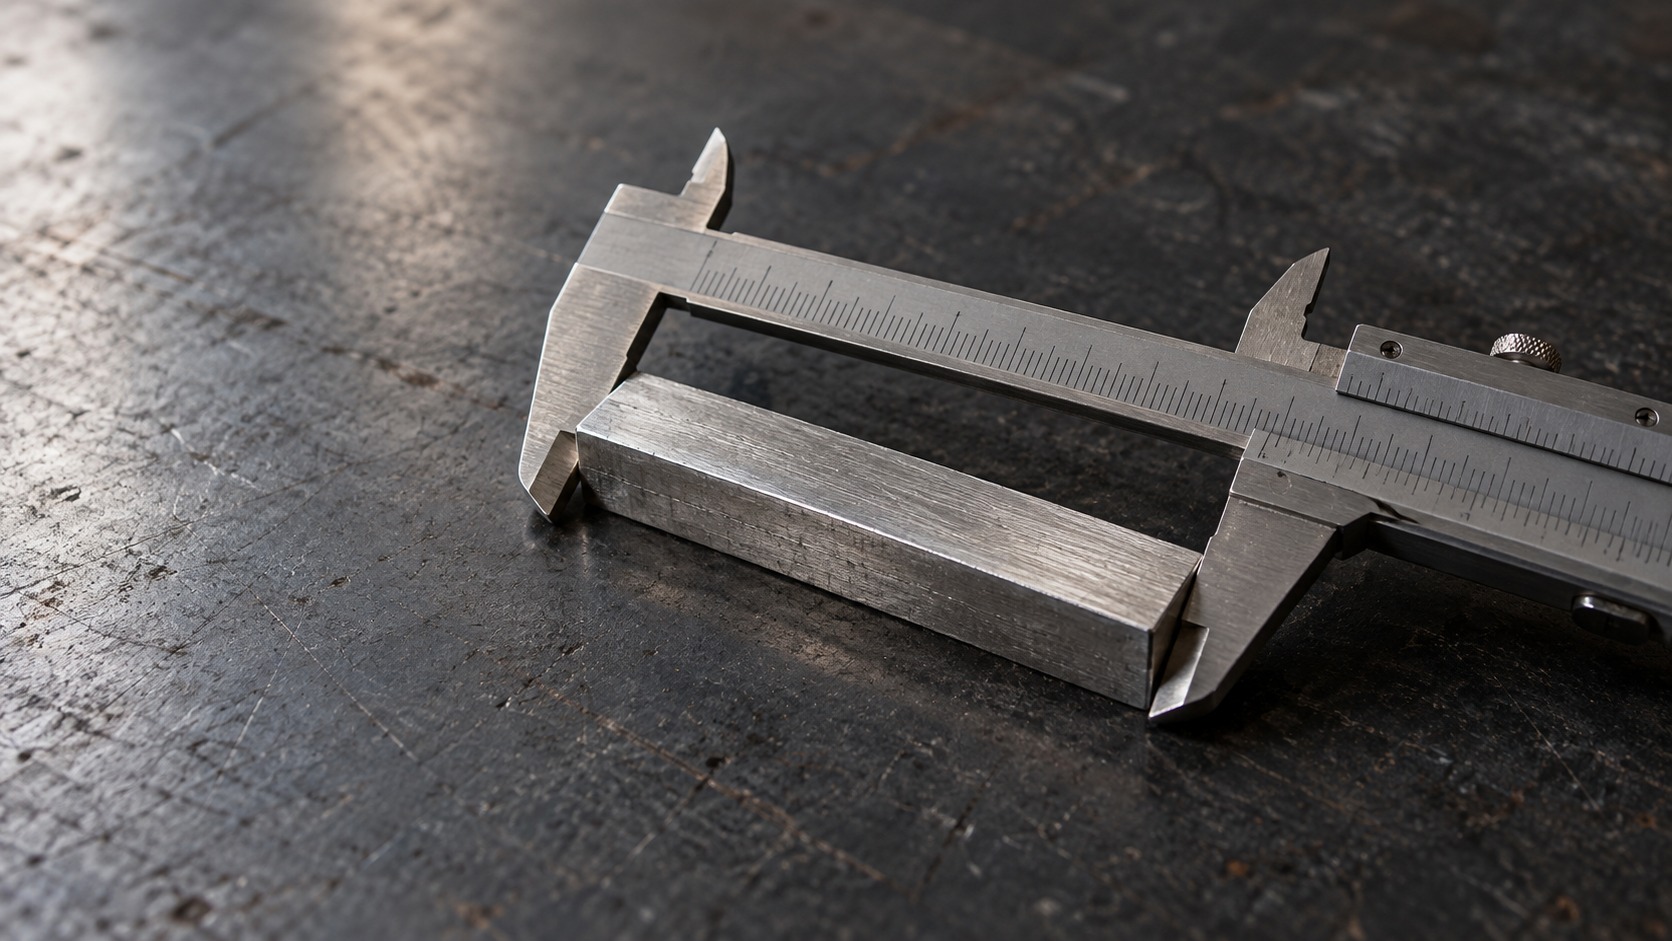
OpenAI image generation / AI-generated
Why repeated readings scatter, what averaging can improve, and which assumptions must hold before more readings help.
What is random error?
Random error is the component of measurement error that varies unpredictably between repeated measurements. It contributes to the scatter of readings obtained under stated conditions. VIM: random measurement error.
For example, a balance may show slightly different values each time the same stable object is placed on it. Small fluctuations in the measuring system or in its environment can affect the indications.
Does a changing reading always mean random error?
No. The quantity itself may be changing.
A thermometer in cooling water should show a falling temperature. That change is part of what we intend to measure. Calling the whole change “measurement error” would confuse the behaviour of the water with the behaviour of the instrument.
To investigate repeatability, use a sufficiently stable quantity and keep the relevant conditions controlled. Also record the order and time of readings: a steady drift may indicate a trend that a simple average hides.
What can repeated readings tell us?
Suppose five illustrative readings of one stable object are:
10.1 g, 9.9 g, 10.0 g, 10.2 g and 9.8 g.
Their mean is 10.0 g. Their sample standard deviation is approximately 0.16 g.
The mean summarises the observations. The standard deviation describes their spread. Neither establishes that the true mass is exactly 10.0 g. A systematic offset could be present in every reading.
In particular, the standard deviation is not the largest possible error, and a random effect does not guarantee a bell-shaped distribution.
Why can averaging help?
When observations are independent, refer to the same stable quantity and follow a suitable statistical model, the estimated standard uncertainty of the mean is:
u(mean) = s / √n
Here, s is the sample standard deviation and n is the number of observations. For the five readings above, the estimate is approximately 0.071 g.
This describes the statistical contribution associated with estimating the mean. It is not the complete measurement uncertainty. Calibration, resolution and other relevant contributions may also need to be included. NIST: Type A evaluation.
Does taking more readings always help?
The formula has conditions. Ten consecutive display updates may not provide ten independent observations if the instrument smooths its output or responds slowly.
Repetition also cannot remove a common zero offset. If each indication is high by 0.3 g, their average keeps that offset.
Under otherwise comparable conditions, reducing the standard uncertainty of the mean by half requires about four times as many independent observations. Before collecting more data, check whether independence, stability and the chosen method are reasonable.
How can random variation be reduced?
Choose a suitable instrument and use a consistent procedure. Where relevant, shield the setup from vibration or draughts, allow it to settle and repeat the complete measurement rather than merely copying an unchanged display.
Keep enough observations to assess spread, along with the method and conditions. Investigate unusual results instead of deleting them automatically.
What follows?
Repeated measurements help us assess variability. Averaging can improve an estimate when its assumptions hold, but confidence in the result also requires checks for systematic effects.
See Systematic Error and the Measurement Error overview.
Ai disclosure: written with the help of AI (ChatGPT). You are encouraged to point out errors and omissions.